
Membrane Technology
MBR Foaming: Causes, Diagnosis, Control and Prevention
Understand MBR foaming causes, EPS and surfactants, filamentous organisms, diagnosis, control measures, and prevention of membrane impacts.
What is foaming in an MBR?
Foam is a layer of gas bubbles stabilized by surface-active material at the gas–liquid interface. In an MBR, bubbles generated by biological aeration and membrane air scouring can become surrounded by surfactants, extracellular polymeric substances (EPS), hydrophobic compounds, or biological material. When the films between bubbles remain stable, the foam accumulates rather than collapsing quickly [1] [2].
Some transient foam during start-up or after a wastewater-composition change may be short-lived. Persistent brown, tan, white, sticky, or unusually stable foam deserves investigation because it may indicate a change in biology, influent chemistry, solids inventory, aeration, or membrane-tank hydraulics. MBR foaming should not be diagnosed from colour alone.
Why foaming matters in an MBR
Persistent foam can trap mixed liquor suspended solids (MLSS), making the effective solids inventory and solids-retention time (SRT) more difficult to estimate and control [1]. Foam can also reduce effective freeboard, contaminate walkways and equipment, create slip and hygiene hazards, generate odour, and increase cleaning and maintenance requirements.
At process level, a stable foam layer can interfere with gas transfer and surface aeration behaviour, remove biomass from the liquid phase, and alter the apparent concentration of solids in the reactor [2]. In MBR systems, foam can also become associated with membrane fouling or a foam trap, especially when foam and scum are repeatedly returned to the membrane zone [2]. The operational response should therefore address both the visible foam and the underlying process condition.
Quick troubleshooting guide: condition → cause → symptoms → solution
Use this table as a first-screening guide. It identifies likely patterns, but the same visual foam can have more than one cause; confirm the diagnosis with operating data, samples, and microscopy where appropriate.
| Operating condition | Confirming evidence to collect | Specific first response | Do not do this |
|---|---|---|---|
| New white foam appears during start-up, after a tank refill, or after a cleaning/occupancy change | Record the onset time; compare it with chemical use, occupancy, MLSS, temperature, and start-up history. Confirm that foam is not carrying solids and that TMP/permeability are stable. | Stop or divert the identifiable concentrated detergent/cleaning source where the site permits; use equalization; stabilize the biomass; remove foam from unsafe areas; observe the trend for 24–48 hours before escalating if it remains short-lived and the process is stable. | Do not lower aeration or dose antifoam merely because a thin, transient layer is visible. |
| Thick brown/tan foam persists for more than 24–48 hours, carries solids, or reduces freeboard | Measure foam coverage and stability each shift; reconcile MLSS/MLVSS and wasting; verify aerobic-zone DO profile; review calculated SRT; obtain microscopy if available. | Maintain safe containment and remove accumulated foam; correct any verified DO deficiency toward the approved biological target; restore the wasting rate to the plant’s design SRT unless nitrification or permit requirements require otherwise; recheck solids inventory daily. | Do not increase SRT simply because the foam is brown, and do not shorten SRT until ammonia, nitrite, temperature, and nitrifier stability have been checked. |
| Foam starts after an industrial batch, tanker delivery, process wash, or grease-control upset | Match the foam timestamp to production and cleaning logs; sample equalization/influent for pH, COD, FOG, and relevant surfactants; inspect screens, grease traps, pumps, and mixing. | Isolate or control the source; retain or equalize the affected wastewater where designed; restore grease control; remove collected scum under the approved solids procedure; trend membrane performance. | Do not use colour alone to diagnose grease, and do not add chemicals before compatibility and discharge implications are reviewed. |
| Foam increases after a blower, header, diffuser, valve, liquid-level, or membrane-air-scour change | Compare air flow, valve position, pressure, DO, TMP, permeability, and foam location between trains; inspect for blocked/damaged diffusers and local turbulence. | Return the affected train to the last verified configuration if safe; rebalance gradually within OEM/design limits; verify DO, mixing, TMP, permeability, and scour distribution after each change. | Do not reduce total air blindly or push foam below the surface at the expense of oxygen transfer, mixing, or membrane protection. |
| Foam is accompanied by rising TMP, falling permeability, solids in the membrane zone, or overflow risk | Trend flux, TMP, permeability, air scour, MLSS, viscosity, cleaning history, and membrane integrity; inspect the membrane zone for scum return, sludging, or blocked channels. | Escalate as a combined foam-and-fouling event; protect containment, follow the site fouling/sludging procedure, and involve the membrane OEM or process engineer before chemical treatment. | Do not treat only the visible foam or assume a normal TMP means the membrane zone is unaffected. |
Cause-and-effect chain: from influent loading to membrane impact
A useful way to interpret an MBR foam event is to follow the chain rather than assign a cause from colour alone:
- Influent or return-stream input: detergents and surfactants lower surface tension; FOG, proteins, lipids, and food-waste digestate add hydrophobic or slowly biodegradable material; poor solids capture can return fines and concentrated solids.
- Biological selection or stress: the loading and operating history influence EPS production, floc structure, and the relative advantage of hydrophobic filamentous organisms. High or drifting SRT, low F/M, low-temperature lipid storage, low DO gradients, septicity, and nutrient imbalance are possible selection pressures—but they do not identify one organism by themselves.
- Foam stabilization: surfactants reduce surface tension, while hydrophobic cells, filaments, EPS, and trapped solids stabilize the air–water interface. Aeration and membrane air scour then supply the gas that expands and transports the foam.
- Solids and dewatering effects: persistent foam can retain MLSS outside the liquid inventory, cause carryover, return scum to the process, and alter sludge rheology. A FOG- or protein-rich sludge can also increase polymer demand or reduce dewatering performance; this must be demonstrated with site records rather than assumed.
- Membrane consequence: the changed solids, viscosity, EPS, and scum-return pattern can increase fouling pressure, reduce permeability, raise TMP, disturb air-scour performance, or contribute to module-zone sludging. A foam event with stable membrane trends may remain primarily a surface-containment issue; a foam event with worsening TMP or permeability is a combined biological, solids, and membrane investigation.
This chain explains why water spraying or antifoam may reduce the visible symptom without correcting the cause. It also explains why a source investigation, solids inventory, dewatering trend, microscopy, and membrane-performance trend should be reviewed together.
Main types and causes of MBR foam
EPS-associated biological foam
Specialist MBR studies report stable brown foam even when obvious foam-forming filaments are not dominant. One explanation is that MBRs retain more EPS and associated surface-active bacterial products than conventional activated-sludge systems, allowing EPS-stabilized foam to persist [1] [3]. Stressful operating conditions, rapid changes in loading, oxygen limitation, unbalanced nutrients, or poor solids control may increase the likelihood of EPS-associated foaming.
Filamentous foaming: major organism groups, operating conditions, and differentiated control
Filamentous bacteria are normal members of activated sludge at low abundance; the problem occurs when a foam-forming population becomes sufficiently abundant, hydrophobic, or entangled with EPS to retain gas bubbles and mixed-liquor solids at the surface. A brown, persistent foam layer is therefore not proof of one particular organism. MBRs can also produce stable EPS-associated foam without a dominant foam-forming filament because the membrane retains solids and associated extracellular material in the bioreactor [1] [3].
The most useful distinction is between nocardioform actinomycetes, Microthrix-related filaments, and other filaments that are primarily associated with bulking but may contribute to foam. These groups overlap in their preferred conditions, so microscopy with appropriate staining, and where necessary molecular identification, should precede a targeted biological intervention.
| Filament group | Common characteristics and field associations | Useful diagnostic clues | Control emphasis | SRT implication |
|---|---|---|---|---|
| Nocardioform actinomycetes: Nocardia, Gordonia, and related Rhodococcus or Tsukamurella forms | Hydrophobic cell surfaces; stable, sticky brown scum; often associated with FOG or other hydrophobic substrates, relatively high sludge age, low F/M, and warm wastewater. Surfactants can strengthen the surface-retention effect. | Branched or irregular Gram-positive/partly acid-fast filaments; foam is often persistent, greasy or leathery, and may carry solids. Gordonia has been directly identified in wastewater foaming sludge [10]. | First control the FOG/hydrophobic source, prevent scum trapping and return, confirm adequate DO and mixing, and restore wasting to the approved SRT. A selector or controlled feast/famine arrangement may be considered where the process layout supports it. Site-specific selective wasting or chemical treatment requires specialist and OEM review. | A high or drifting SRT is a control opportunity, but there is no fixed “Nocardia SRT.” If the actual SRT is above the design requirement and nitrification is protected, a controlled reduction may reduce the retention advantage; do not shorten it solely from foam colour. |
| Microthrix-related filaments: especially Candidatus Microthrix parvicella | Hydrophobic, lipid-accumulating actinomycete associated with bulking and foaming; often favoured by FOG, low temperature, low F/M, long SRT, and some low-oxygen or selector conditions. It can persist even when the surface foam is not obviously greasy [9]. | Long, thin, non-branched or gently curved filaments in suitable microscopic preparations; often accompanied by poor settling, viscous brown foam, and a winter or low-temperature trend. Identification should not be made from temperature or foam appearance alone. | Reduce FOG loading, correct selector and anaerobic/anoxic feed conditions where relevant, verify the DO profile, and examine whether the SRT is unnecessarily high. Because Microthrix competes strongly under low-load and low-temperature conditions, process changes should be evaluated across the seasonal load and temperature range. | SRT reduction can be particularly relevant when Microthrix is confirmed, but it must be limited by nitrifier requirements, temperature, ammonia and nitrite performance. The target is the plant’s validated nitrification-safe SRT—not a generic short SRT. |
| Other filamentous bulking organisms: examples include Type 021N, Type 0092, Type 0041, Type 0675, Type 1851, and Nostocoida limicola forms | More commonly associated with low F/M, low DO, septic or stale feed, nutrient imbalance, or industrial wastewater conditions and poor floc structure. Some can contribute to surface scum, but their presence does not automatically explain stable brown foam. | Filament morphology, Gram/Neisser staining, sulfur inclusions, sheath characteristics, branching, and location in or outside the floc help distinguish types. A general “filament count” is not enough for a differentiated control decision. | Correct the verified selection pressure: restore oxygen distribution if DO is deficient, eliminate septic zones, verify nutrient balance, improve selector conditions, and address industrial toxicity or substrate imbalance. Use F/M and wasting changes only as part of a broader process correction. | Do not choose a new SRT from the organism name alone. For many bulking filaments, correcting DO, septic conditions, nutrients, or selector hydraulics is more important than shortening SRT; any SRT trial must protect nitrification and membrane operation. |
Reported numeric associations—not MBR design targets
The supplied filamentous-bulking review and the Parklink operational article report the following associations. They are included to make the mechanisms concrete, not to prescribe new MBR setpoints. The sources are not membrane-specific design standards, and several figures are reported plant experiences without a common wastewater, temperature, nitrification, membrane, or permit basis.
| Reported observation | What it may help investigate | Limitation before using it at an MBR |
|---|---|---|
| F/M below approximately 0.15 is associated in the supplied review with several low-loading filament types, including Types 0041, 021N, 0675, 1851, and 0803. | Check whether the plant is over-solids-loaded for its current substrate supply and whether low F/M coincides with high MLSS, unnecessary SRT drift, or low influent loading. | Do not lower MLSS or shorten SRT automatically; nitrification, temperature, flux, viscosity, and permit requirements may make that unsafe. |
| A supplied review cites DO around 4.0 mg/L or higher as having been needed in some high-F/M industrial systems to prevent selected low-DO filaments; other sources use 2 mg/L as a general investigation threshold. | Check spatial DO profiles, especially the end of the aerobic zone and membrane zone, and verify mixing and diffuser performance. | These are different contexts, not a universal target. Raising air can increase visible foam and energy use, while reducing air can worsen biological selection and membrane protection. |
| Parklink reports Nocardia control below approximately 6–8 days SRT and Microthrix parvicella below approximately 8–10 days at moderate temperatures; the supplied review reports 8–10 days for Microthrix and approximately 3 days for Nocardia. | Compare the plant’s actual calculated SRT with its approved design requirement and identify whether sludge age is drifting upward. | These are reported activated-sludge examples, not MBR instructions. Some MBRs require longer SRT for nitrification or cold weather; an aggressive reduction can cause ammonia breakthrough, solids instability, or membrane problems. |
| Parklink describes Type 1863 as occurring at low sludge age, often below approximately 3–4 days. | Avoid assuming that every foam-forming filament is controlled by reducing SRT; identify the organism and operating pressure first. | A short SRT may be incompatible with the plant’s biology and solids-handling design. The value is a reported association, not a safe operating recommendation. |
The numerical examples should be treated as screening prompts. If a plant considers an SRT or DO trial, it should change one principal variable at a time, document the starting condition, hold the condition long enough for the biological response, and protect ammonia, nitrite, effluent quality, MLSS/MLVSS, TMP, permeability, and membrane air scour. The article’s general trial guidance—small controlled change, at least one complete new SRT, and potentially two to three SRTs before judging a new steady state—still applies.
Shared characteristics—and important differences
Across the groups, the recurring risk factors are hydrophobic or lipid-rich influent, FOG, long or drifting SRT, low F/M, oxygen gradients or low DO, and a process configuration that allows foam and solids to remain at the surface. These are associations, not diagnostic thresholds. For example, a plant may have high SRT and brown foam because of nocardioforms, while another plant may have brown foam from EPS without a large filament population.
The differences matter operationally. Nocardioform foam is commonly approached first through FOG/source control, scum management, and a review of high sludge age and warm-weather conditions. Microthrix is more often investigated alongside low-temperature operation, lipid storage, low F/M, and long SRT; a carefully controlled SRT reduction may be useful when nitrification permits. Other filaments may respond more to restoration of DO distribution, elimination of septic feed, nutrient correction, or selector redesign than to SRT reduction. There is no safe practice of assigning one universal SRT to all foam-forming bacteria.
How to use the comparison in an MBR
- Confirm the phenotype: record foam stability, texture, odour, solids carryover, temperature, and whether TMP or permeability changes. Do not identify an organism from colour alone.
- Confirm the biology: obtain representative mixed-liquor and foam samples for microscopy, including Gram and Neisser staining where appropriate. Consider molecular testing when morphology is ambiguous or the control decision is consequential.
- Correct the least-disruptive verified cause first: control FOG and industrial inputs, remove septic conditions, restore DO and mixing, and reconcile the solids inventory before changing SRT.
- If an SRT trial is justified: compare actual SRT with the approved design target, adjust wasting in a controlled step, and monitor ammonia, nitrite, MLSS/MLVSS, DO, foam stability, TMP, permeability, and effluent quality for at least one complete new SRT; two to three SRTs may be needed before a new steady state is interpreted.
- Reserve chemical or selective biological controls for expert review: chlorine, peroxide, polymer, antifoam, return-sludge treatment, or other interventions can damage non-target biomass, alter oxygen transfer, affect membranes and seals, or create discharge and reuse risks. They should never substitute for organism identification and source control [2] [4].
Microscopy and trend records are especially important in MBRs because membrane separation can retain EPS and filament-associated solids even when conventional settling indicators are unavailable. The decision should therefore combine organism evidence with the membrane indicators—flux, TMP, permeability, air scour, and cleaning frequency—rather than relying on sludge-volume observations alone.
Surfactant and detergent foam
Domestic detergents, cleaning chemicals, industrial surfactants, and intermittent process discharges can reduce surface tension and generate white or persistent foam. A sudden foam event after a change in occupancy, cleaning practice, industrial discharge, or tanker delivery should trigger an influent investigation. Surfactant-driven foam may occur without a major change in filament abundance.
Grease, oil, and hydrophobic-compound foam
Fats, oils, grease, and other hydrophobic compounds can stabilize bubbles and collect at the liquid surface. These materials may arrive in the influent, bypass grease control, or be released by industrial activities. Grease-related foam can be associated with odour, scum, poor screening performance, and localized deposits around air-distribution equipment or membrane modules.
Start-up, low-solids, and changing-load foam
Start-up foam can result from surfactants entering a reactor before a mature biological community has developed. Foam may also occur after major wasting, low MLSS, a sudden organic-load change, long idle periods, temperature changes, or a shift from one wastewater source to another. These conditions should be recorded because the correct response may be stabilization and monitoring rather than immediate chemical suppression.
Aeration and hydraulic foam
Excessive surface turbulence, uneven air distribution, blocked or damaged diffusers, membrane air-scour imbalance, gas release near tank walls, or a poorly adjusted recycle flow can make foam appear worse. Aeration changes should not be made solely to push foam below the surface; they must be checked against oxygen-transfer, mixing, membrane-scouring, nitrification, and energy requirements.
How to diagnose MBR foaming
Foam diagnosis should combine visual observation, operating data, wastewater investigation, and biological examination. A useful record includes foam colour, texture, persistence, thickness, surface coverage, odour, location, time of onset, relation to aeration or air scouring, and whether foam is being carried into the membrane zone.
Useful measurements and tests
Routine field observations can be supplemented by foam coverage, foam volume, foam stability, foam rating, foam power, scum index, or foaming-scum-index methods [2]. These tests are most useful when repeated consistently and compared with operating trends. Surface-tension measurement and EPS analysis can help distinguish a surface-active or EPS-associated mechanism, while microscopy can identify filamentous or nocardioform involvement [2] [3] [4].
The operator should review DO, ORP, temperature, pH, MLSS, MLVSS, SRT, wasting, influent COD and FOG, surfactant events, air flow, membrane flux, TMP, permeability, cleaning frequency, and foam location. A single sample or single visual inspection rarely establishes the root cause. Use the following decision sequence rather than repeating the same visual classification in a second table:
- Containment and safety: record foam height/coverage, protect walkways and equipment, and check freeboard and overflow paths.
- Source timing: compare the onset with cleaning, occupancy, production, tanker, grease-trap, or chemical events.
- Biology: check the aerobic DO profile, MLSS/MLVSS, wasting record, calculated SRT, temperature, pH, nutrients, ammonia, and nitrite. Obtain microscopy when persistent brown foam or filaments are suspected.
- Hydraulics and membranes: compare air flow, pressure, valve position, liquid level, TMP, permeability, flux, and foam location between membrane trains.
- Verification: make one controlled change at a time and document whether foam stability, solids inventory, DO, effluent quality, and membrane performance improve.
Practical operating thresholds: what to change, and when
The following values are investigation and control bands, not universal MBR setpoints. The plant design basis, permit, wastewater temperature, nitrification requirement, membrane OEM limits, and validated operating history take precedence. A foam event should trigger a controlled diagnosis; it should not be used as a reason to change several setpoints at once.
Dissolved oxygen (DO)
If any aerobic zone repeatedly measures below approximately 2.0 mg/L, especially at the end of the aerobic zone or near a membrane cassette, treat that as a biological and hydraulic investigation trigger. The wastewater-treatment literature associates low DO conditions, indicatively below 2 mg/L, with selection for some foam-forming filaments [2]. The response is normally to restore the plant’s approved DO target and verify mixing and air distribution—not automatically to maximize DO. If DO is already above the approved target and foam persists, increasing air further may only increase turbulence and energy use; investigate influent chemistry, EPS, SRT, and microscopy instead.
Measure DO at more than one location and at representative loading conditions. A single handheld reading near a diffuser is not evidence that the whole aerobic zone is adequately oxygenated. Any aeration change must be checked against ammonia, nitrite, ORP, mixing, TMP, permeability, and membrane air-scour requirements.
SRT and wasting
There is no defensible universal “foam SRT.” MBRs are often operated at longer SRTs than conventional activated sludge, but the correct value depends on temperature, nitrification, nitrogen limits, MLSS capacity, oxygen transfer, membrane viscosity, sludge production, and the design basis [8]. Do not lengthen SRT simply because foam is dark, and do not shorten it solely from visual appearance.
A controlled SRT reduction can be considered only when records or microscopy support a foam-forming filament/EPS mechanism and nitrification remains protected. As a practical trial structure, calculate the actual SRT from the complete solids inventory, compare it with the approved design target, and move the wasting rate in a small step—typically about 10–15% from the current wasting rate, unless the engineer of record specifies otherwise. Hold the new condition long enough to observe the biological response; a minimum of one complete new SRT is a starting point, while two to three SRTs may be needed before interpreting a new steady state. During the trial, require stable ammonia/nitrite, DO profile, effluent quality, MLSS/MLVSS, membrane performance, and foam trend. Stop or reverse the trial if nitrification deteriorates, solids become unstable, TMP/permeability worsens, or the permit risk increases.
The article should not prescribe “set SRT to 10, 15, or 20 days” for every MBR. Those numbers can be valid for one design and unsafe for another, particularly in cold weather or where nitrification is required. A preliminary municipal design range may be used only as a project-specific engineering starting point, not as a foaming cure.
Antifoam or defoamer concentration
There is no single recommended concentration in mg/L for MBR antifoam. Commercial formulations differ in active chemistry, emulsions, carrier oils, and membrane compatibility; the safe dose is product- and plant-specific. Use antifoam only when foam threatens containment, safety, equipment, or continuous solids loss, and only after the source-control actions above have started.
The minimum acceptable control procedure is:
- obtain written approval from the process engineer, membrane OEM, and discharge/reuse authority where applicable;
- perform a bench or jar screen using the actual mixed liquor and the proposed product, including a no-product control and the vendor’s lowest approved dose;
- select the lowest dose that breaks the foam for the required operating period, rather than a dose that makes the surface look clear for a few minutes;
- use only the vendor’s approved stock dilution, injection point, and maximum daily dose; never infer a safe dose from a different product;
- trend DO/oxygen-transfer response, TMP, permeability, effluent quality, membrane cleaning frequency, and residual effects for at least the site-defined verification period.
If the vendor cannot provide a membrane-compatibility statement and a dose range, the product should not be introduced into an MBR as an improvised treatment. Surface spraying or mechanical removal may be safer for short-term containment, subject to the site procedure.
MLSS, F/M, and feast/famine
MLSS and F/M should be corrected toward the approved process design and stable biological condition, not toward a generic foam number. When feast/famine or selector operation is considered, treat it as a process redesign or controlled trial. The published MBR study cited below found an F/M of approximately 0.40–0.50 kg COD/kg TSS·d useful for its PHA/EPS objective under its specific laboratory configuration, but that result is not a universal municipal-MBR foam setpoint [7].
F/M ratio, feast/famine operation, and foaming
The food-to-microorganism ratio, commonly written as F/M, can influence foaming indirectly through changes in microbial selection, EPS production, sludge age, and floc structure. It should not be treated as a standalone foam diagnostic or universal control setpoint. The same calculated F/M can represent different biology depending on wastewater composition, temperature, SRT, DO, selector configuration, nutrient balance, and the way soluble versus particulate substrate is measured.
| F/M-related condition | Possible foaming relationship | Symptoms and checks |
|---|---|---|
| Sudden increase in F/M after a load rise or biomass loss | A rapid substrate load relative to available biomass can destabilize the biology and increase soluble products or transient foam | New or changing foam after a production or occupancy increase; review COD/BOD loading, MLSS, MLVSS, temperature, DO, and recent wasting. |
| Very low or declining F/M caused by underloading, excessive biomass, or long SRT | A chronically low-load system may select for different organisms and can be associated with filamentous or hydrophobic sludge in some plants; the relationship is site-specific rather than deterministic | Brown or stable foam, high sludge age, low load per biomass, difficult wasting control, or deteriorating sludge properties; review SRT, F/M trend, microscopy, and sludge inventory. |
| Rapidly changing F/M between zones or over the day | Alternating substrate-rich and substrate-poor conditions may select differently from a stable, well-distributed load | Foam follows batch discharges, intermittent occupancy, or equalization changes; compare zone-by-zone substrate and DO profiles with foam timing. |
Can feast/famine operation help control foaming?
Yes, in selected systems, feast/famine operation or a biological selector can be part of a foam-control strategy, but it is not a universal remedy. A deliberately high-substrate “feast” period followed by a lower-substrate “famine” period can promote organisms that rapidly take up and store substrate, while reducing the competitive advantage of some filamentous populations. Selector-based approaches are commonly used to influence filamentous-bulking and foaming risk, and feast/famine operation has also been investigated in MBRs for its effects on EPS and membrane fouling [6] [7].
In practice, the method requires a suitable process layout and enough control over feed distribution, mixing, recycle, aeration, SRT, and loading. A plug-flow or staged biological arrangement may create a more useful substrate gradient than a completely mixed tank, but the result depends on the wastewater and the organisms already present. Feast/famine operation should therefore be designed and validated as a biological process change—not improvised by abruptly changing feed or aeration.
A practical evaluation sequence is to establish the current F/M, SRT, MLSS/MLVSS, substrate profile, DO/ORP profile, foam trend, microscopy, and membrane-performance baseline. If a selector or staged feast/famine strategy is considered, define the intended feast and famine zones or periods, confirm adequate mixing and oxygen transfer, and monitor foam stability, filament abundance, EPS indicators, settling or dewatering behaviour, nutrient removal, TMP, permeability, and effluent quality. If the foam worsens, the change should be reversed or re-evaluated under engineering supervision rather than continued on the assumption that adaptation will occur.
F/M correction may involve controlled wasting, equalization, feed redistribution, improved selector conditions, or a change in operating SRT. It should not mean simply increasing wasting or reducing aeration without checking nitrification, denitrification, mixing, membrane air scour, and solids-retention requirements. The objective is a stable and well-characterized biological condition, not a generic F/M number.
Representative MBR foaming case studies
These cases are written as evidence-led field patterns. The readings are illustrative operating records, not universal setpoints; each plant must confirm its own design basis, permits, OEM limits, and sampling quality.
Case study 1: Transient white foam confirmed as a detergent event during start-up
Observed condition. During the third week after commissioning a domestic MBR, a thin white foam layer appeared after the morning occupancy peak and again after a building-cleaning discharge. The foam was most visible over the aerated bioreactor, collapsed within 2–6 hours, and did not coincide with a TMP or permeability change. MLSS was still increasing as the biomass matured.
Evidence and finding. The onset times matched the cleaning log and a grab sample from the equalization outlet showed a marked surfactant response compared with the previous day. The foam was not brown, did not carry visible solids, and microscopy did not show a filament-dominated scum. The finding was therefore a short-lived surfactant/start-up foam event, not a membrane-fouling failure.
Corrective action. Concentrated cleaning discharges were stopped from entering the process without equalization. The site retained and mixed the affected equalization volume where its design permitted, maintained the approved biological aeration and mixing settings, and removed foam from slippery access areas. No antifoam was used. The team recorded foam coverage, MLSS, DO, TMP, permeability, and influent events for the next 48 hours.
Verification. Foam disappeared as the cleaning source was controlled and the biomass matured; MLSS and membrane indicators continued on their expected trends. The transferable lesson is that a short-lived white foam with stable membrane performance should first trigger source timing and containment—not a blind change to DO, SRT, or chemical dosing.
Case study 2: Persistent brown foam confirmed as solids-age and low-DO stress with foam-forming filaments
Observed condition. An established municipal MBR developed thick brown foam over several weeks. The plant’s calculated SRT had drifted from its approved operating target because wasting had been reduced. End-of-zone DO measurements were repeatedly below approximately 2.0 mg/L, while microscopy showed abundant foam-forming filaments. Foam retained solids at the basin perimeter, and the daily solids inventory no longer reconciled with the wasting record.
Evidence and finding. The simultaneous SRT drift, low DO profile, filament observation, stable brown foam, and solids loss provided a coherent diagnosis. This was not treated as proof that every brown foam event is caused by filaments; in this case, the evidence supported a foam-forming biological population amplified by inadequate oxygen distribution and uncontrolled solids age.
Corrective action. Operators first restored the approved air distribution and corrected the low-DO locations, confirming mixing and membrane-scour requirements rather than simply increasing total blower output. The team recalculated SRT from the complete inventory and moved wasting in a controlled step toward the plant’s design target. During the trial, ammonia, nitrite, MLSS/MLVSS, DO, TMP, permeability, and foam stability were checked daily. Surface foam was removed for containment; no non-selective oxidant was applied.
Verification. The intervention was accepted only after DO remained within the approved operating band, ammonia/nitrite stayed compliant, the solids inventory reconciled, and foam coverage and stability declined over the observation period. The lesson is that SRT should be shortened only when the actual SRT is above the plant’s design requirement and nitrification is protected; “shorter is better” is not a valid general rule.
Case study 3: Glossy foam confirmed as a food-processing surfactant/FOG discharge
Observed condition. A municipal–industrial MBR that normally had little foam developed glossy white-to-brown foam within hours of a food-processing equipment wash. The strongest foam was at the equalization outlet and membrane-tank inlet. An oily sheen and sticky deposits were visible on the screen channel, and permeability fell temporarily.
Evidence and finding. Production and cleaning records matched the onset. Samples from the equalization outlet showed elevated FOG and surfactant indicators compared with the normal influent composite. Inspection found that the grease-control unit had been bypassed during the wash. The confirmed cause was a concentrated industrial discharge, not a general biological SRT problem.
Corrective action. The source was isolated and the affected equalization volume was managed according to the plant’s design and discharge procedure. Grease-control equipment was returned to service, accumulated scum was removed as process solids, and the membrane train was monitored for TMP, permeability, and integrity. Antifoam was not used until product compatibility and downstream consequences had been reviewed.
Verification. Foam declined after source control and equalization; membrane indicators recovered without an unscheduled chemical clean. The lesson is to connect foam alarms to production, cleaning, and grease-control records. A colour-based diagnosis alone would have sent the operators toward the wrong correction.
Case study 4: Localized foam and filtration loss confirmed as air-distribution imbalance
Observed condition. Foam increased immediately after a membrane-air-scour header modification. It was concentrated above one cassette, where the affected train showed higher TMP and lower permeability than adjacent trains. The other trains did not show the same biological change.
Evidence and finding. Air-flow and pressure readings showed unequal distribution, and inspection found a valve position and diffuser condition inconsistent with the approved configuration. The location-specific foam, violent bubbling, and train-to-train filtration difference confirmed a hydraulic/aeration problem with secondary fouling risk, not a site-wide foam biology event.
Corrective action. The affected train was returned to the last verified safe configuration. Air distribution was rebalanced gradually within the membrane supplier’s limits, while DO, mixing, TMP, permeability, flux, and foam location were checked after each change. The membrane-zone inspection and the site sludging/fouling procedure were used to determine whether physical cleaning was required. Total air was not reduced blindly.
Verification. The train-to-train TMP and permeability difference narrowed after the air-distribution defect was corrected, and foam no longer concentrated at the cassette. The lesson is that localized foam after an equipment change is an instrument and hydraulic investigation first; changing SRT or adding antifoam would not correct the cause.
Mitigation and control of MBR foaming
Immediate operational response
First protect people, equipment, and process containment. Restrict access to slippery areas, prevent foam from entering sensitive equipment or surface drains, and confirm that freeboard and overflow paths remain safe. Record the condition before applying multiple simultaneous changes.
Where the design permits, operators may use controlled surface spraying, foam collection, skimming, or temporary foam-breaking measures. These actions reduce the visible symptom but do not identify the cause. Any collected foam or scum should be handled as process solids and returned or removed according to the approved solids-management procedure.
Find and remove the source
Review recent changes in influent quality, cleaning chemicals, industrial production, occupancy, grease control, screening, equalization, sludge wasting, SRT, aeration, and membrane air scour. Inspect the headworks and grease-control systems. If an industrial or commercial discharge is suspected, collect representative samples and coordinate with the responsible source rather than relying on a one-time grab sample.
Correct biological and solids conditions
If filamentous growth, EPS accumulation, or abnormal sludge conditions are suspected, evaluate the biological process as a whole. Review oxygen distribution, mixing, nutrient balance, SRT, wasting, anoxic/anaerobic conditions, temperature, and loading. Corrective actions should be based on data and, where needed, microscopy or specialist biological assessment. Uncontrolled chemical dosing intended to kill filaments can damage the process, alter membrane compatibility, or create a new effluent problem.
Use antifoam or defoamer only as a controlled supplementary measure
Antifoam products may provide short-term relief when foam threatens containment or safety, but they are not a substitute for source control. Product selection must consider oxygen transfer, biological activity, membrane permeability, membrane and seal compatibility, downstream reuse, chemical cleaning, discharge permits, and the possibility of persistent residues. Use only an approved product, approved dose range, controlled injection point, and documented monitoring plan.
Review aeration and membrane air scouring
Foam can be worsened by excessive turbulence or poor air distribution, but reducing air without confirming oxygen and mixing requirements can cause nitrification loss, filamentous growth, membrane fouling, or solids accumulation. Inspect blowers, control valves, headers, diffusers, membrane air-scour distribution, and tank mixing. Adjustments should be tested gradually and evaluated against DO, ORP, TMP, permeability, and energy trends.
Prevention and monitoring programme
A practical prevention programme combines routine observation with trend-based control. Operators should record foam coverage and stability during every shift or inspection round, photograph unusual events, and correlate changes with MLSS, SRT, wasting, DO, air flow, TMP, permeability, temperature, pH, influent FOG, and chemical events.
The plant should define escalation triggers in its operating procedures. Examples include foam reaching a defined freeboard limit, repeated foam carryover to membrane modules, rising foam stability, measurable MLSS loss in foam, simultaneous foam and permeability deterioration, or recurrence after a corrective action. The numerical trigger should be site-specific rather than copied from another plant.
Preventive measures may include reliable screening and grease control, equalization of intermittent loads, influent source control, stable sludge wasting, avoidance of unnecessary SRT drift, balanced aeration, clean air-scour distribution, prevention of stagnant zones, and early removal of small accumulations. The objective is not to eliminate every bubble but to prevent persistent foam from becoming a solids-loss, safety, biological, or membrane-performance problem.
Relationship to membrane fouling, sludging, and cleaning
Foaming, fouling, and sludging are related but different conditions. Foam is a gas–liquid surface phenomenon; fouling is resistance caused by deposits on or within the membrane; and sludging or clogging involves physical solids accumulation, bridging, matting, ragging, or blockage around channels, modules, or aerators. A single plant may experience all three at the same time.
A foam event accompanied by rising TMP or falling permeability should therefore be investigated through the plant’s fouling and sludging procedures, not treated only with a defoamer. Useful companion guides include MBR Membrane Air Scouring, MBR Sludging and Clogging, Membrane Cleaning, Membrane Types & Materials, and MBR Monitoring & Troubleshooting.
Field engineering observations, design details, and operating lessons
The following observations come from field inspection and equipment review. They are included to show how foam texture, location, solids behaviour, and upstream source conditions can be interpreted together. The photographs and videos are case evidence, not laboratory identification. A visual or tactile impression cannot replace representative sampling, microscopy, FOG analysis, solids-inventory reconciliation, and review of membrane-performance data.
Field observation 1: creamy, slightly greasy, non-sticky foam after a grease-trap overflow
The first video shows a small sample of MBR foam being touched during a field observation. The foam had a creamy texture and was slightly greasy, but it was not strongly sticky or slimy. The field diagnosis associated this event with an upstream restaurant grease-trap overflow. That interpretation is consistent with a short-duration hydrophobic loading event, but it should be confirmed with grease-trap records, influent FOG sampling, and the timing of the foam onset.
The practical lesson is to inspect commercial kitchen and grease-control systems before changing MBR biology. A grease-trap overflow can add a sudden FOG load that changes surface behaviour immediately, while a sustained or repeated load can select for hydrophobic, foam-forming populations. Direct hand contact with wastewater foam is not a recommended routine test; future sampling should use appropriate gloves, eye/face protection, hygiene controls, and a suitable sample container.
Field observation 2: severe foaming associated with food-waste digestate and solids dewatering difficulty
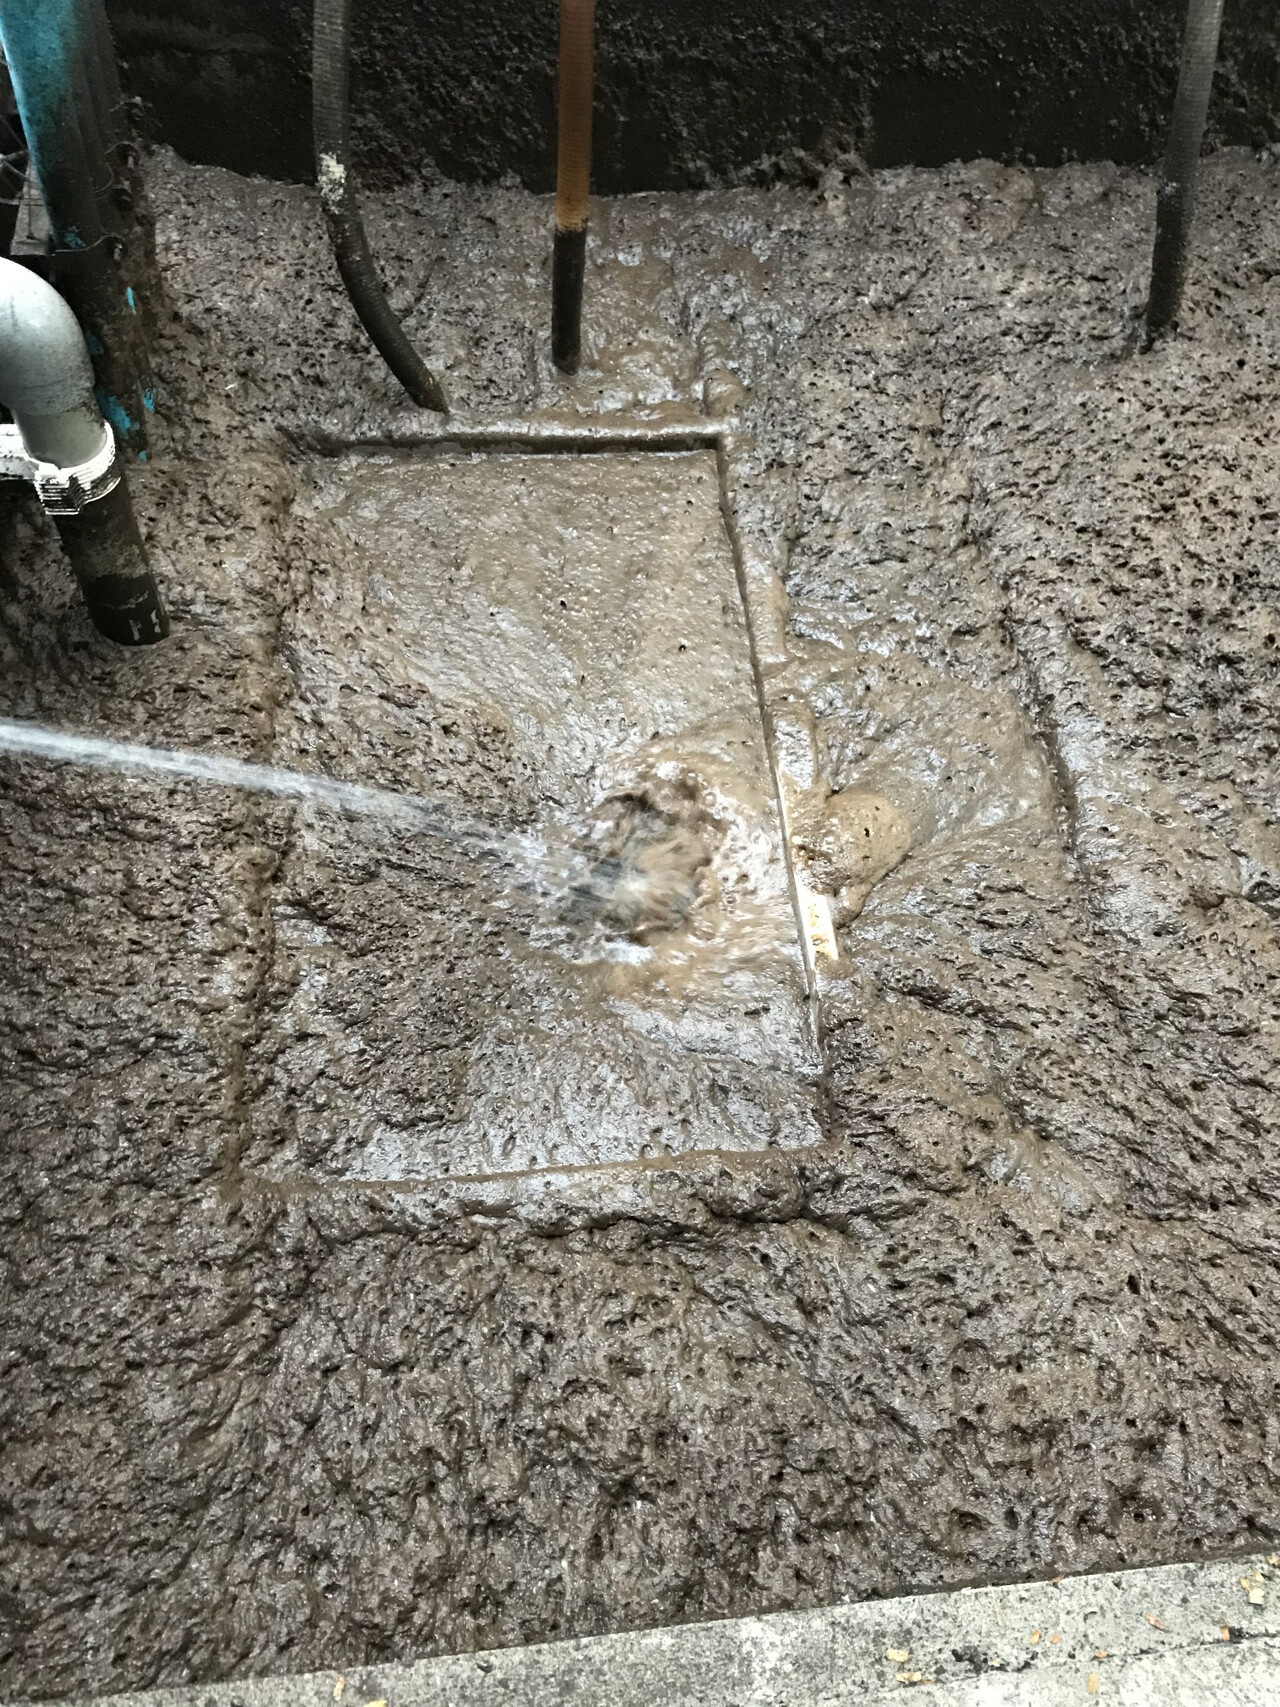
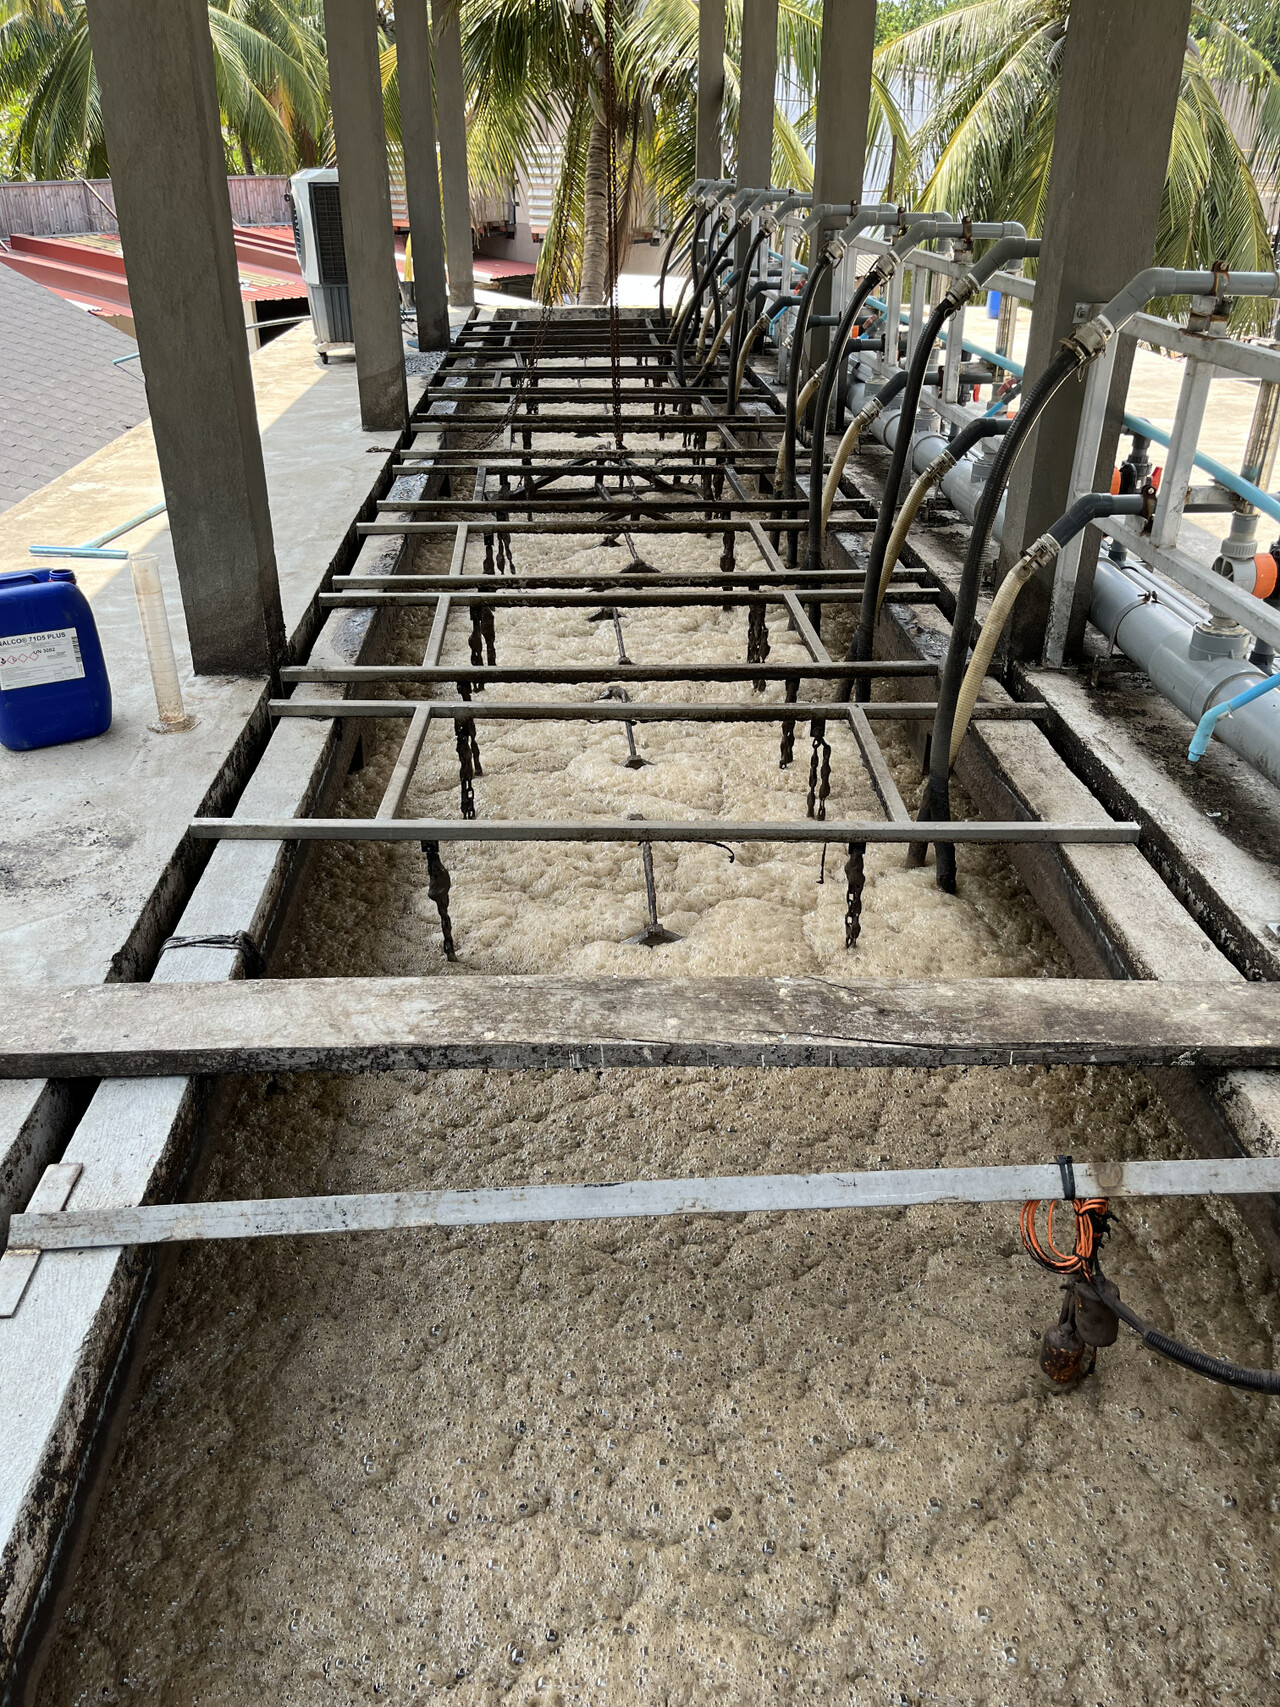
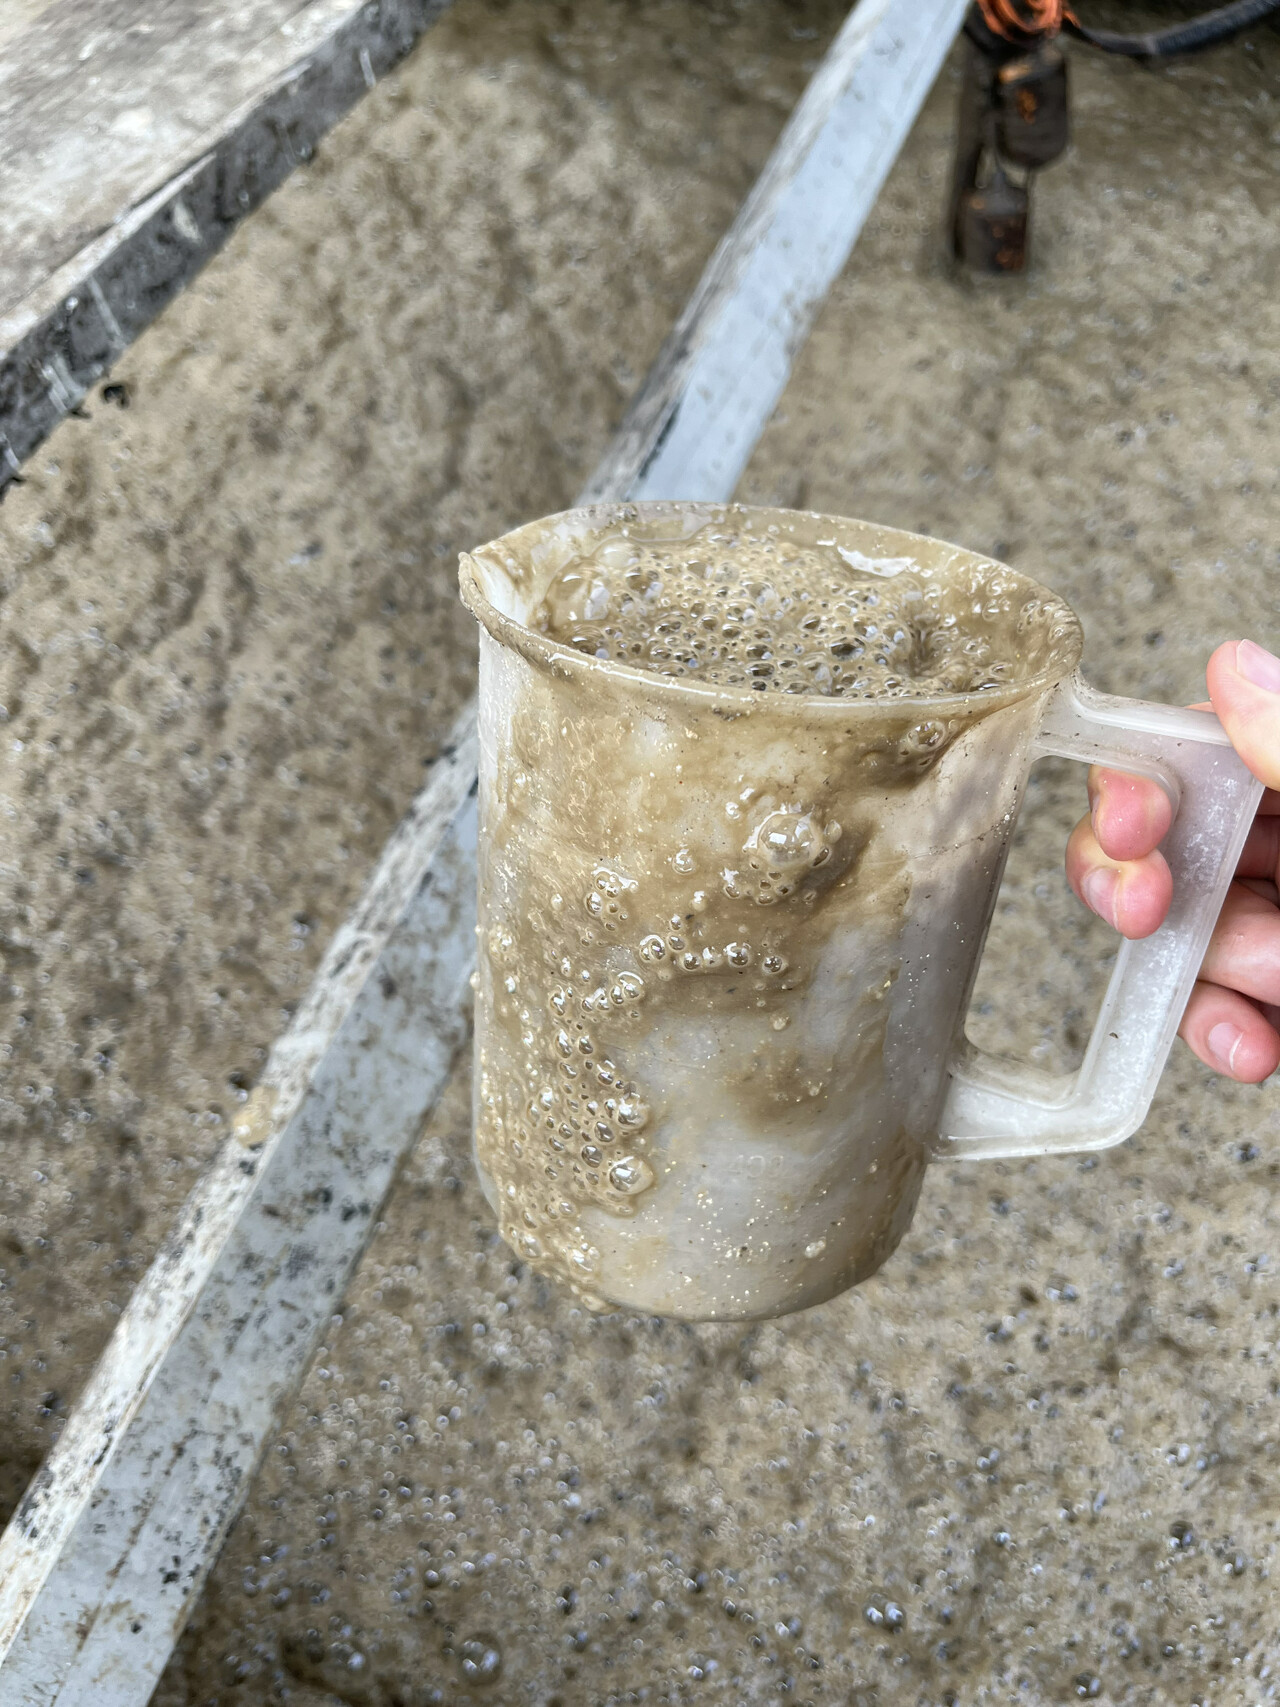
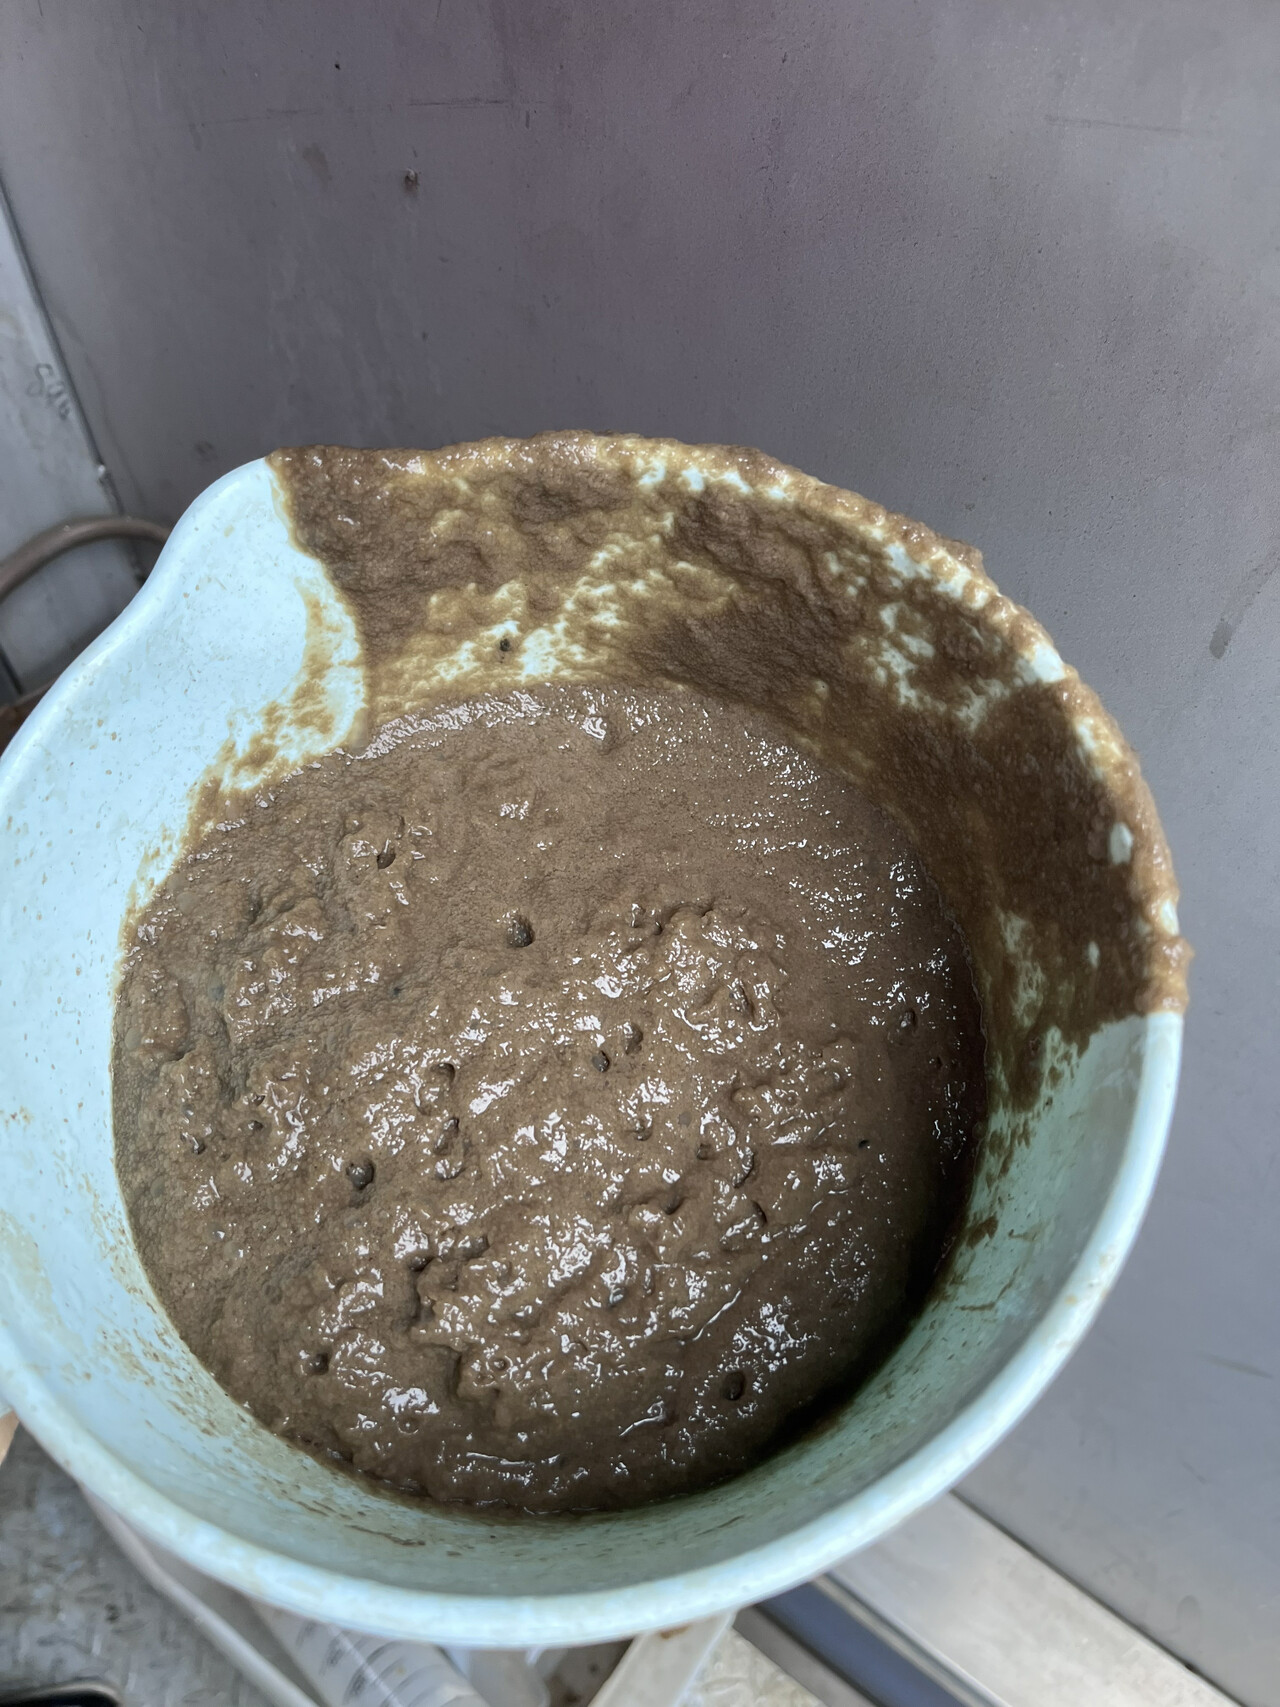
Pictures 3–7 document one field inspection. The aeration-tank photograph shows severe foam covering the MBR aeration area. The two beaker photographs show foam and mixed liquor with a slimy, viscous appearance. The walkway photograph shows dried foam deposits after overflow or carryover. The final photograph shows an influent grease chamber with heavy deposits and a high-strength, food-waste-related influent condition.
The field finding was a strong FOG-and-protein loading associated with a food-waste digestate stream being introduced directly into the sewage treatment plant influent. The resulting sludge characteristics also made dewatering difficult, which can create a feedback loop: poor solids separation and dewatering can increase return loads, scum retention, and operational instability, while the persistent foam can carry solids out of the intended process inventory. The membrane performance was affected by the sludge condition; in an MBR, a change in sludge rheology, EPS, viscosity, or solids distribution can increase fouling pressure and reduce effective permeability even when the immediate cause first appears to be “only foam.”
The correct response is not to treat these photographs as proof of a particular filament. The site should quantify and control the digestate and FOG load, inspect and clean the grease-control path, review equalization and feed-point design, reconcile MLSS/MLVSS and wasting, and trend dewatering polymer demand, cake solids, TMP, permeability, flux, air scour, and cleaning frequency together. Where the food-waste stream is intentional, it should have a defined acceptance basis, equalization capacity, controlled dosing or blending, and a process-impact review rather than an unrestricted connection to the sewage inlet.
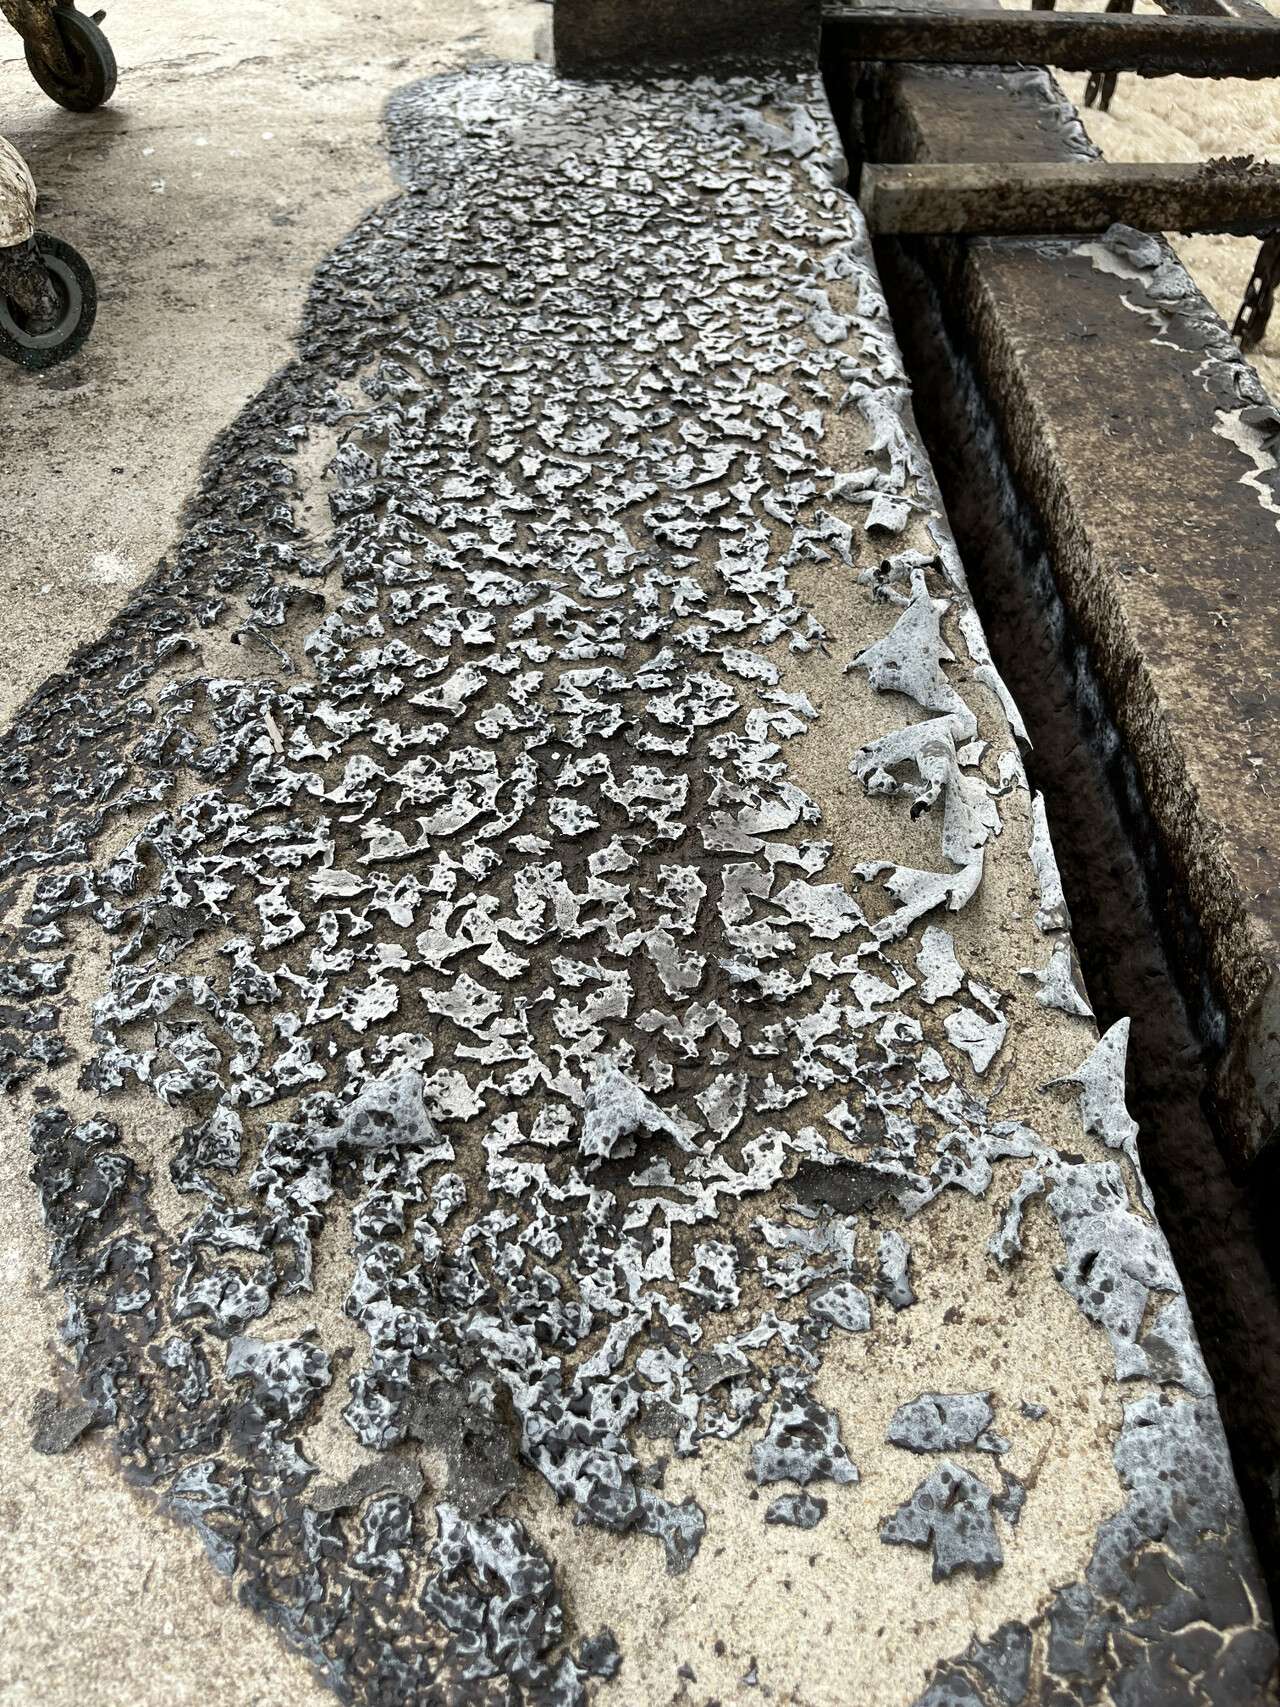
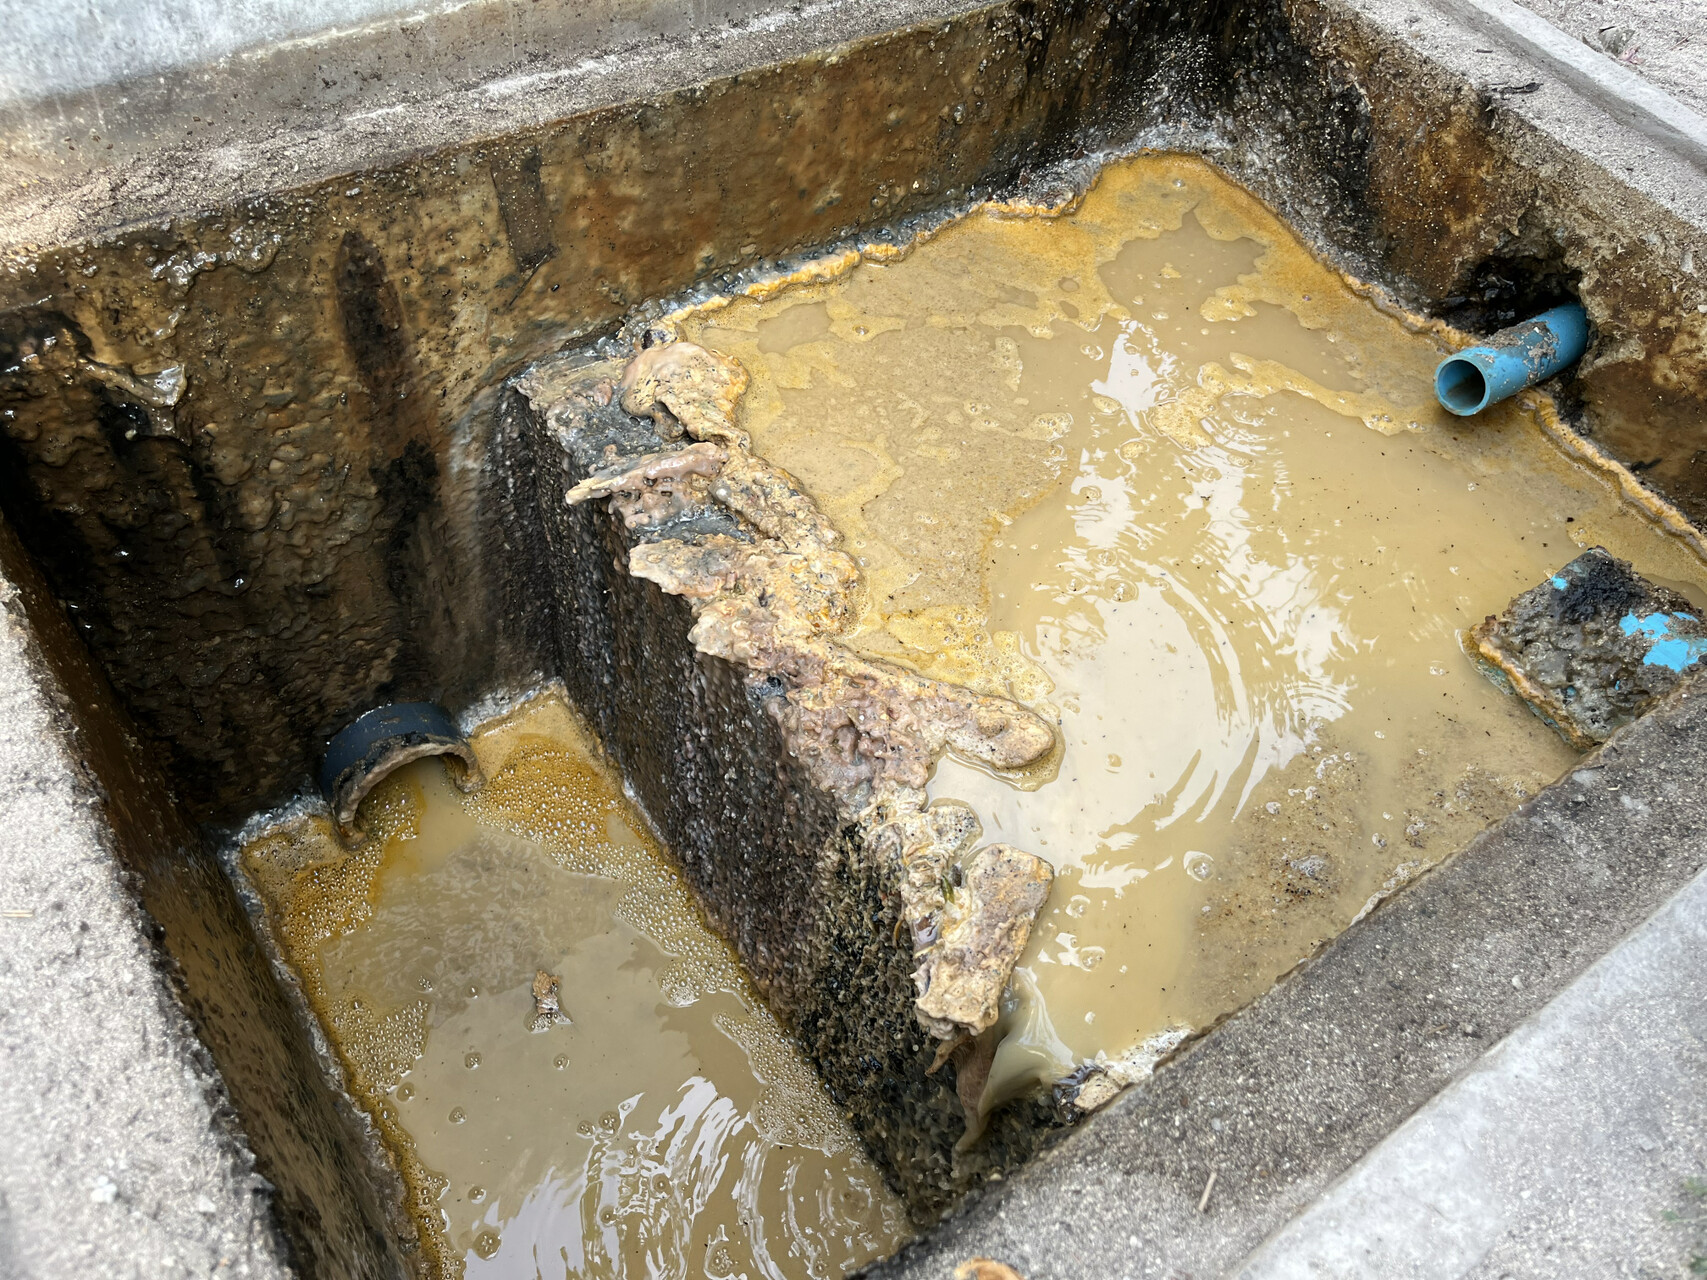
Design observation: anoxic-tank mixing can reduce stagnant foam and scum zones
The second video shows an anoxic-tank arrangement in which a submerged mixer is oriented toward the overflow or recirculation outlet. This arrangement can help move floating foam and scum toward the outlet instead of allowing it to stagnate in a corner or along a dead zone. It is a hydraulic-design idea, not a universal retrofit instruction: mixer thrust, tank geometry, recirculation rate, overflow elevation, access, and downstream loading must be checked by the process and mechanical designers.
In some configurations, a coarse-bubble diffuser grid at the tank bottom can supplement mixing and help prevent foam or scum from remaining stagnant in an anoxic tank. It must be evaluated against the purpose of the anoxic zone, oxygen-transfer intrusion, nitrate-removal performance, blower capacity, noise, and energy use. The design should not unintentionally aerate an anoxic zone or create an uncontrolled short-circuit to the overflow.
Operational perspective: suppression is not root-cause correction
Water spraying, controlled surface removal, and approved antifoam dosing or spraying may help protect walkways, equipment, freeboard, and process containment. They suppress the visible symptom; they do not solve the biological or sludge-growth condition. Repeated suppression without source control can hide a rising solids inventory, an unresolved FOG load, low-DO selection, an inappropriate SRT, poor dewatering, or developing membrane fouling.
The recommendations in this article must therefore be applied selectively. The same brown foam appearance can arise from different combinations of FOG, EPS, filamentous organisms, sludge age, temperature, DO, nutrient balance, digestate loading, and tank hydraulics. A responsible field response links the visual evidence to sampling, microscopy, upstream source records, solids accounting, dewatering results, and membrane trends before choosing an intervention.
Safety and engineering limitations
Foam control chemicals, biological selectors, oxidants, surfactant treatments, and changes to aeration or wasting can affect the biological process and membrane system. Do not enter a tank or remove a membrane module without approved isolation, lockout/tagout, confined-space controls, gas testing, lifting controls, and site authorization. Do not assume that a chemical compatible with activated sludge is compatible with the membrane, seals, potting, coatings, permeate equipment, or downstream reuse process.
This article provides troubleshooting guidance, not a universal operating recipe. Setpoints, product selections, sampling plans, and corrective actions must be confirmed against the site design basis, permits, OEM requirements, and competent engineering or biological advice.
References
[1]: The MBR Site, “Foaming in MBRs: measurement and evaluation”
[2]: Collivignarelli et al., “Foams in Wastewater Treatment Plants: From Causes to Control Methods,” Applied Sciences, 2020, 10(8), 2716
[3]: Di Bella et al., “Foaming in membrane bioreactors: identification of the causes,” Journal of Environmental Management, 2013
[4]: Bafghi et al., “Role of Nocardia in Activated Sludge,” 2016
[5]: The Effect of Surfactants on Nocardia Foaming in Activated Sludge
[6]: Chua et al., “Effect of food:microorganism ratio in activated sludge foam,” Water Science and Technology, 2000
[7]: Corsino et al., “Membrane Fouling Mitigation in MBR via the Feast–Famine Strategy,” Membranes, 2022
[8]: U.S. EPA, “Wastewater Management Fact Sheet: Membrane Bioreactors”
[9]: Rossetti et al., “Microthrix parvicella, a filamentous bacterium causing bulking and foaming in activated sludge systems: a review of current knowledge,” FEMS Microbiology Reviews, 2005
[10]: Liu et al., “Bacteriophages of wastewater foaming-associated filamentous Gordonia,” Scientific Reports, 2015
[11]: D’Antoni, Iracà & Romero, “Brief review on filamentous foaming and bulking in activated sludge treatments: Causes and mitigation actions,” supplied technical report, Panta Rei Srl (user-provided PDF; reviewed September 22, 2026).
[12]: Parklink, “Control methods for filamentous foaming”
[13]: EnviroZyme, “Causes and Cures for 6 Common Types of Foaming in Water Resource Recovery”
Editorial note: foam appearance is highly site-specific. The most reliable response is a documented diagnosis followed by targeted process correction, not repeated application of a general-purpose defoamer.
Related guides
Continue with the Fouling Mechanisms, Monitoring & Prevention guide, MBR Membrane Air Scouring, MBR Sludging and Clogging, Membrane Cleaning, and MBR Monitoring & Troubleshooting.